Exploring AT Protocol with Python
Thu Nov 14 2024In the last few weeks, there has been a lot of activity on Bluesky. Bluesky is a social network built on open standards. Specifically, it is built on top of the AT Protocol. Most (if not all) data is exposed via XRPC endpoints.
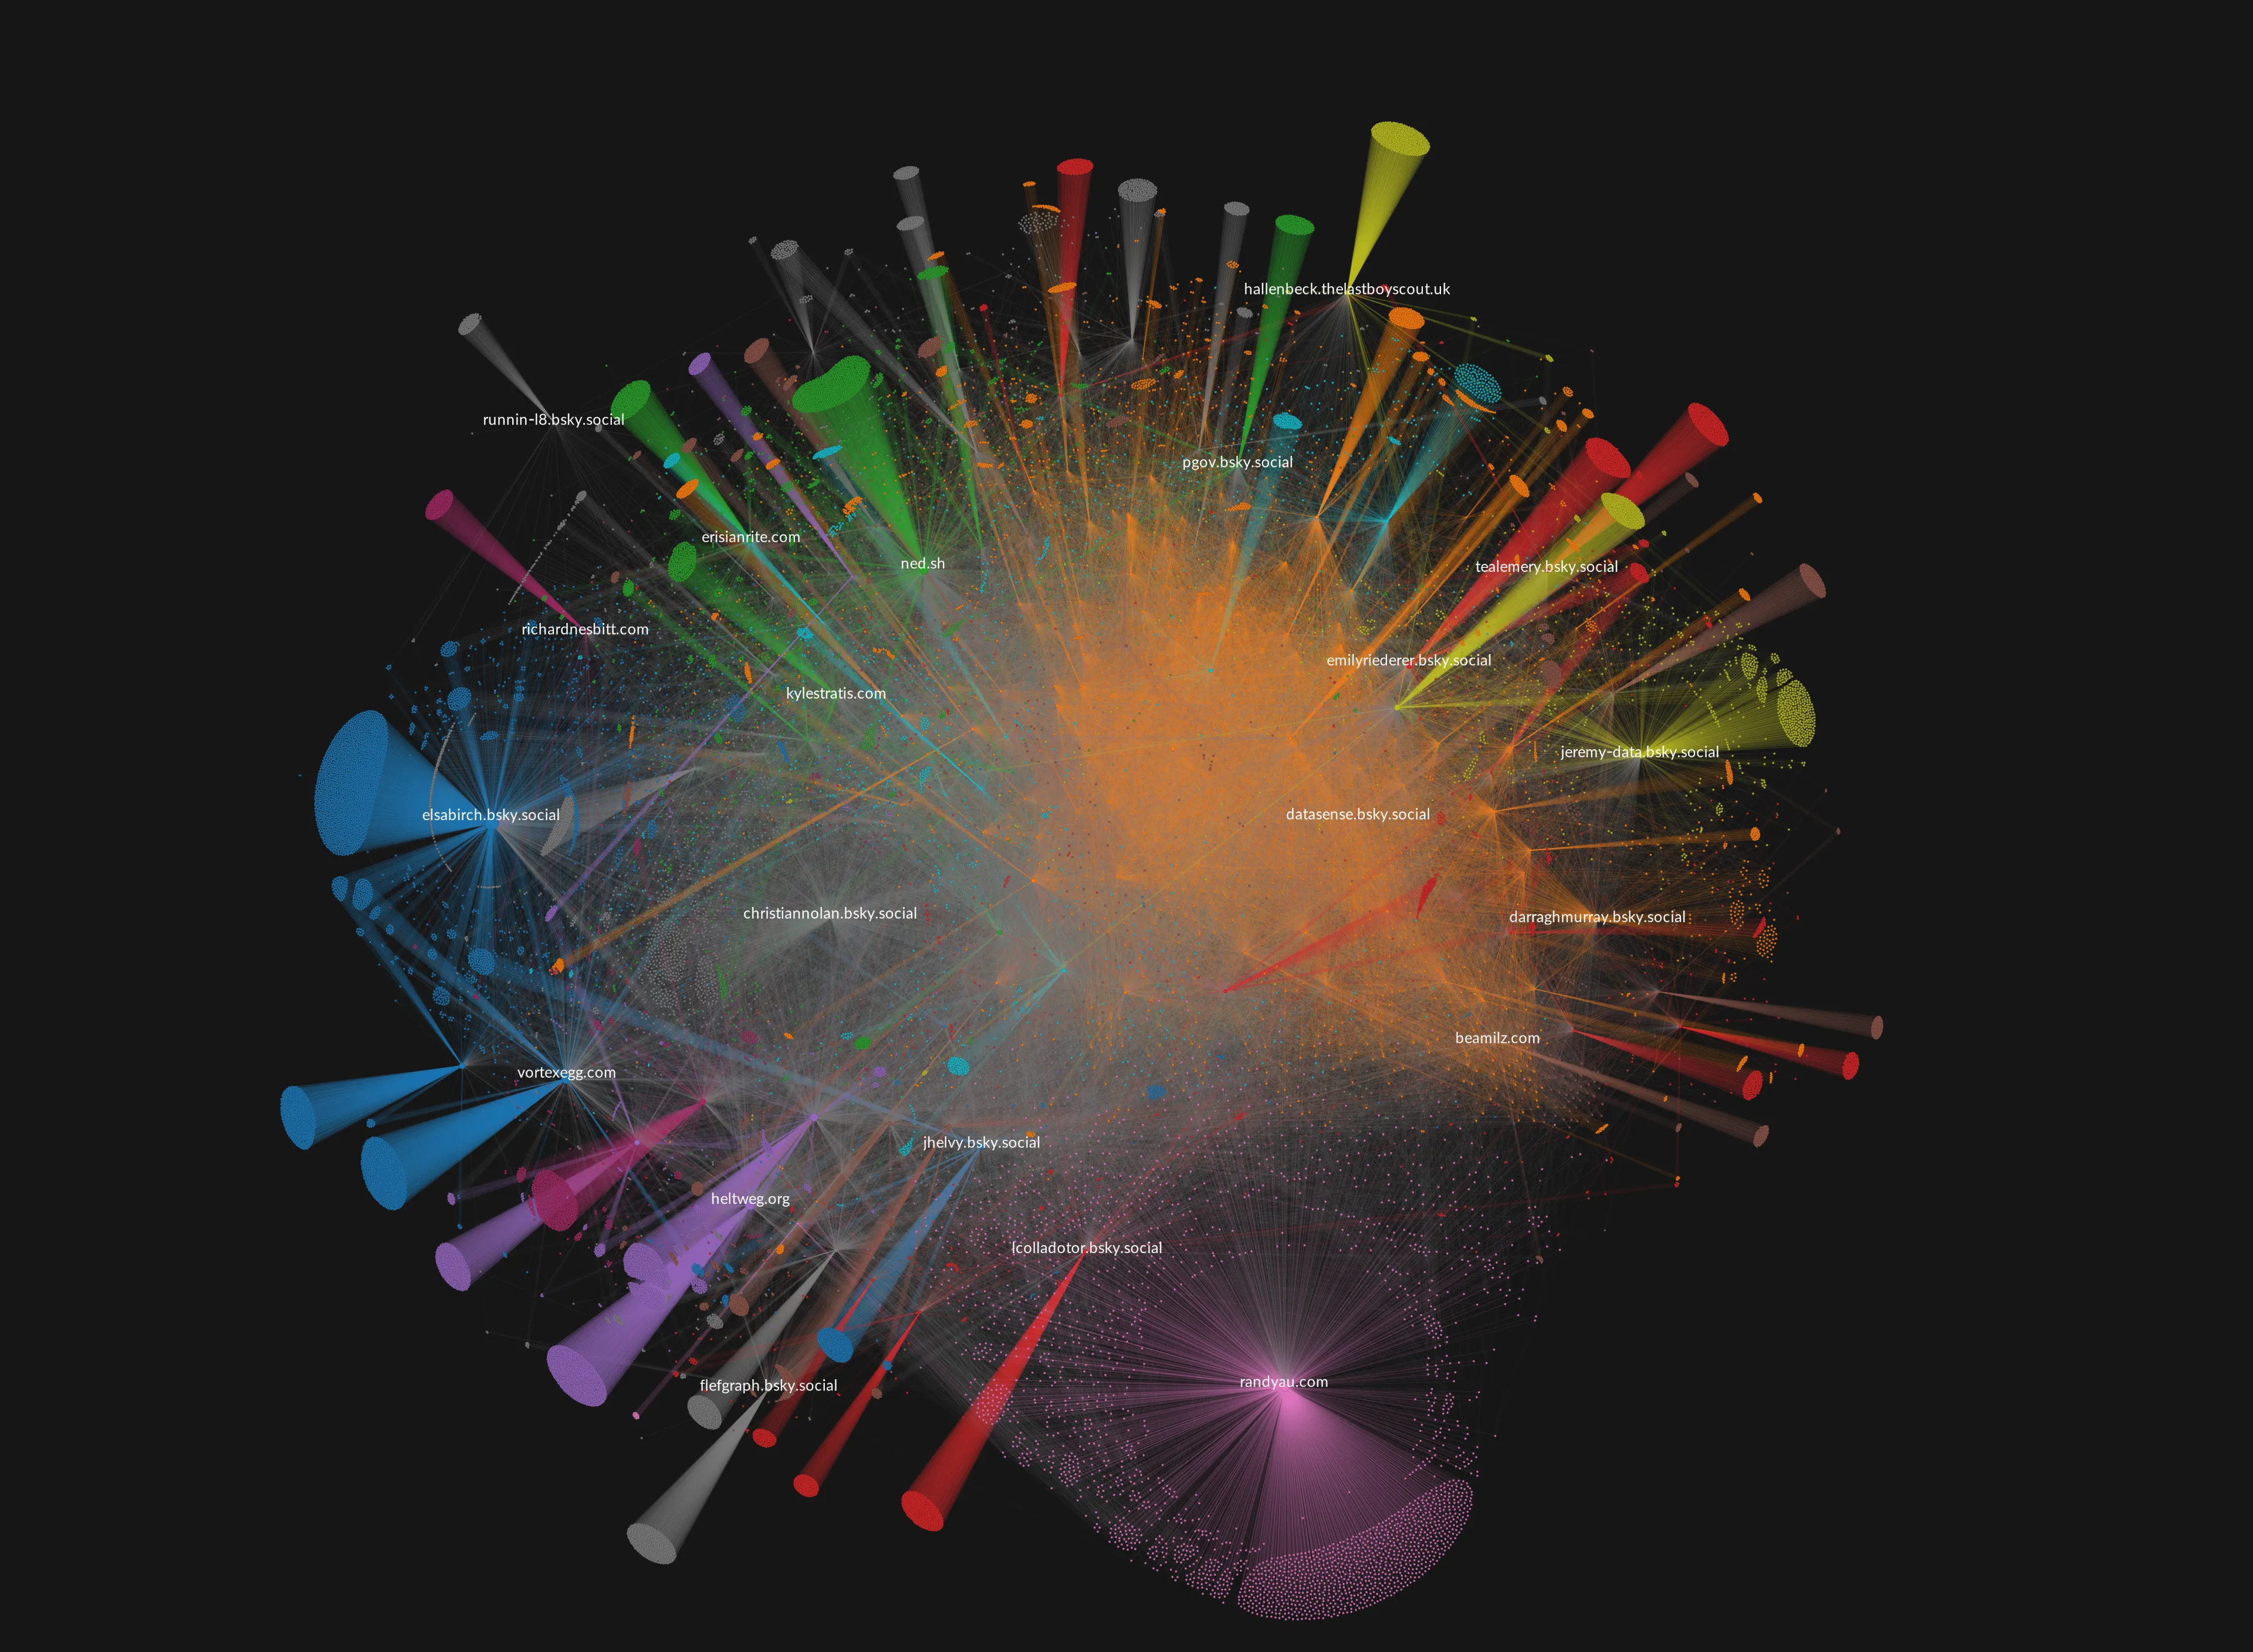
This post is a quick glance at the AT Protocol and its Python SDK. To do that we’ll create a script to download all the #dataBS posters and create a graph with the connections around that community.
You can explore the final interactive graph online!
Setup
To follow along, you’ll need to install the atproto Python package and, since we’ll be using some API endpoints that require authentication, you’ll need to have an account there and get your credentials.
Once you have your credentials, you can create the client with:
from atproto import Client

client = Client()
profile = client.login('yourusername.com', 'hopefully-not-12345678')
If you are using uv, you can spin up a quick Jupyter Notebook with atproto installed with:
uvx --with 'atproto' --with 'jupyterlab' jupyter labGetting the posts
To get all the #dataBS posts, we can use the app.bsky.feed.searchPosts. From the Python SDK, this is mapped to app.bsky.feed.search_posts. The endpoint returns a cursor that we can use to paginate through the results.
cursor = None
databs_posts = []

while True:
    fetched = posts = client.app.bsky.feed.search_posts(params={'q': '#databs', 'cursor': cursor})
    databs_posts = databs_posts + fetched.posts

    if not fetched.cursor:
        break

    cursor = fetched.cursor
Getting the social graph
Each post has a post.author.handle property that can be used in our next XRPC call to app.bsky.graph.getFollows endpoint. This endpoint returns all the actors that the given actor follows (also using the cursor property to paginate through the results).
We can write a quick function to get all the follows for a given actor:
def get_all_follows(author):
    cursor = None
    follows = []
    while True:
        fetched = client.app.bsky.graph.get_follows(params={'actor': author, 'cursor': cursor})
        follows = follows + fetched.follows
        if not fetched.cursor:
            break
        cursor = fetched.cursor
    return follows
And then we can use that function to get all the follows for all the #dataBS authors. Since we don’t know how big the graph is, we’ll be dumping the results into a CSV file.
Before writing the results, let’s get the unique authors:
unique_authors = list(set(post.author.handle for post in databs_posts))Now we can loop through all the unique authors and get all their follows and some profile information (obtained from app.bsky.actor.getProfile):
from tqdm import tqdm

with open('databs.csv', 'w') as f:

    f.write("source,target,source_avatar_url,source_posts_count,source_followers_count,source_follows_count\n")

    for source in tqdm(unique_authors):

        author_follows = get_all_follows(source)
        source_actor = client.app.bsky.actor.get_profile(params={'actor': source})

        for follow in author_follows:
            f.write(f"{source},{follow.handle},{source_actor.avatar},{source_actor.posts_count},{source_actor.followers_count},{source_actor.follows_count}\n")
This, in Novermber 2024, takes around 30 minutes to run. After that, you should have a databs.csv file with all the connections between the #dataBS authors.
Visualizing the Graph
Although there are many libraries to create graphs in Python, I’ve been a big fan of Graphext for this kind of tasks as it allows you to share the graphs in an interactive way.
Upload the databs.csv file to Graphext, make sure the columns are typed as category and, after creating a source-target graph, you should see something like this:

The graph is also accessible and explorable online!
Conclusion
This small post is a great example of how powerful open APIs can be. The AT Protocol is a great example of that. It allows us to build all kinds of applications on top of it!
If you want to learn more about the AT Protocol, I recommend checking out the official documentation, the Python SDK, and of course, joining the discussion on Bluesky.